Thursday, December 28, 2017

...And the winner is! (Fall 2017)


...And the winner is... (Part II)

Which form of social media reigns supreme among college students today?


You may or may not have seen the results I shared here in April 2017. My Stats class at BGSU in Spring 2017 collected the data, and I used it to demonstrate the one-way ANOVA.

Wednesday, November 8, 2017

#celebratefirstgen


Lyon College, where I teach, participated in today's inaugural nationwide celebration of first-generation college students. This was orchestrated by the Council for Opportunity in Education, and designated for November 8th in honor of the 52nd anniversary of 1965's Higher Education Act.

Lyon's event, which involves collecting these cards and making them into a wall that demonstrates the experiences and values of first-generation college students. Since I'm a first-gen college student, I participated in this event by filling out a card.

You should be able to see my card above, but in case that doesn't work properly on some people's devices, I've also put the text below:

As a 1st-gen college student, I value the role of education in creating 
a better-informed citizenry and pushing the frontiers of knowledge. A liberal arts 
education helped me reach my potential, and now I'm going for a PhD!

***
Wondering about the social media usage of actual college students? 
Check out the results of this totally informal—but realsurvey.

In case you missed it, I review some fantastic, easy-to-use, and FREE stats programs here.
For more help explaining statistical concepts and when to use them, 
please download my freely available PDF guide here!
https://drive.google.com/open?id=0B4ZtXTwxIPrjUzJ2a0FXbHVxaXc

Thursday, October 26, 2017

Is Wikipedia in crisis?


A week ago, WIRED published an opinion piece lamenting the decline of the pursuit of knowledge, and claiming that Wikipedia is in crisis.

I saw the headline, "Social Media is Killing Wikipedia," in an e-mail from LinkedIn. The link led to a brief summary of the article (not the article itself...) along with an extensive discussion chain, complete with the hashtag #WikipediaFuture.

Cute.

I clicked it because I suspected the headline would prove to be an assertion that was either exaggerated or simply untrue. In essence, clickbait.

Alas, I wasn't surprised.

http://www.reactiongifs.com/r/330f.gif

Wednesday, September 6, 2017

What is 'rational?'


I left a comment at a very interesting blog post at http://www.ivigilante.com/where-rationality-ends/. Here's what I wrote:

An interesting article! I think that you brought up rationality in a sense that has more to do with academic notions of what is “ideal” than with the real world. It’s understandable, since most formal education (particularly in economics departments!) focuses on this notion!

Herbert Simon was, as far as I’m aware, the first academic to point out that expecting people to act ‘rationally’ is futile. He won a Nobel Prize for his work on bounded rationality, too, so it’s not like his work went unrecognized. A brief summary: http://www.economist.com/node/13350892
As this page correctly observes, people’s behavior often fails to adhere to even the most basic principles of logic, which leaves humans looking pretty stupid IF you believe that logic–i.e. ‘rationality’–is the best standard to which we should compare behavior.
 

But Gerd Gigerenzer and others (including me) argue the opposite! Rather than saying, ‘Gee, people are pretty dumb because they don’t make decisions the way a computer would make a decision,’ we argue instead that people use shortcuts that are typically well-suited for the real world of vast uncertainty and severe time pressure.

Some interesting reading on Gigerenzer’s approach, which he calls “ecological rationality:” https://hbr.org/2014/06/instinct-can-beat-analytical-thinking and https://www.edge.org/conversation/gerd_gigerenzer-smart-heuristics


In the instance of the gas station that you described above, I’d say you were acting in an ecologically rational manner, probably using a heuristic. I’d guess that your deliberation went something like this:
“This old-timey gas station has ridiculously long lines. I hate long lines! Screw it, I’ll go elsewhere and pay a bit more for my gas. The savings of about $1.00 per fill-up isn’t worth my time and aggravation.”


A standard economic model would require that you sit down and calculate whether the savings of $1 or $2 is actually worth your time and aggravation. Which would, of course, require that you assigned a numerical value to your aggravation, knew how much time you’d spend waiting, and how much of that waiting time you’d actually spend on side hustles (vs. something unproductive), how much money you’d make from the time spent on your side hustle, etc…


When it’s spelled out like that, it becomes painfully obvious that nobody behaves like “homo economicus,” because performing such actions is, in itself, terribly inefficient–not to mention far more imprecise than big-time thinkers would like to admit [i.e. how much IS your aggravation worth? And what if you estimate a 15-minute wait, but it’s actually a 25-minute wait, which causes extra frustration? How much extra frustration would that cause, and what negative effects would that stress have on your health? And, more to the point, how much would it cost to address those negative health effects? Because, remember, we need numbers in order to make the equation work…].


So, to the point of your article: if you buy into Gigerenzer’s notions, rational thought often DOESN’T require complexity–as long as you’re holding people to the standard of ecological rationality, rather than logical-mathematical rationality. 

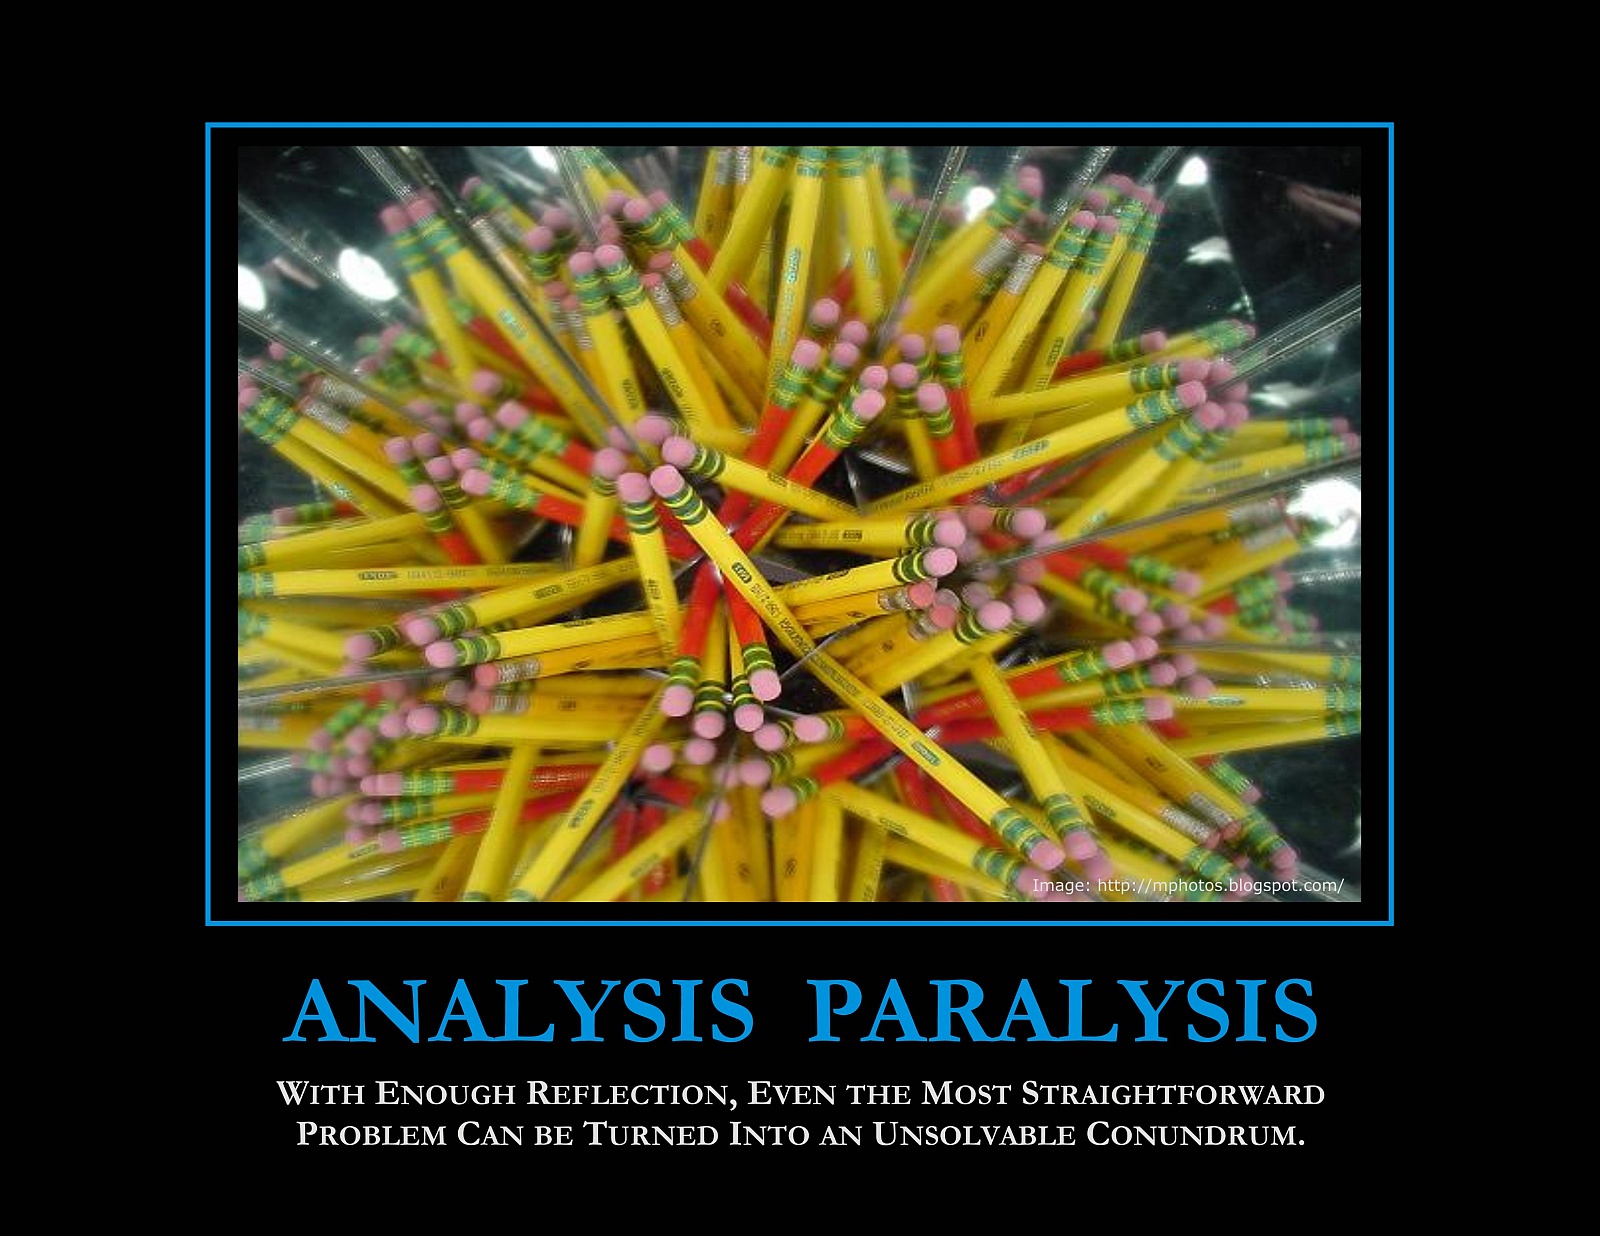
The example above illustrates how ridiculous it is to expect people to make 'rational,' calculated decisions every time they're faced with a choice. Can you imagine stopping to do a calculation like this every time you had to do something?! You'd never accomplish anything, because you'd suffer from "paralysis by analysis."

http://www.cogniview.com/blog/wp-content/uploads/2013/03/Analysis_Paralysis.jpg 

Thus, assuming that your goal is to be productive, it is therefore irrational to be rational!!!

To use the above example of waiting in a long line in order to save $0.10 per gallon on gas, you'd have to quantify everything: how much is your time worth? How much is your frustration worth? How much gas would your car would use at idle while you wait in line for a pump to open up? What is the 'opportunity cost' of  spending time waiting in line for a pump, waiting to pay at the counter, and trying to merge back onto the highway? Furthermore, as another commenter noted at the above article by I, Vigilante, what is the potential cost—in money, in time, and in trouble—of credit-card skimming, or the risk of total identity theft?

By the very nature of calculation, you need to fill in numbers here. But how can you quantify frustration in monetary terms? The very act of filling in this kind of equation requires enough guesswork to make the entire procedure an exercise in futility!

That's a hidden fact about math: it requires certainty about each term in the equation. Once you introduce guesswork, the equation becomes meaningless. It will still give you an answer, but to quote a popular proverb on the subject: "Junk in, junk out."

Essentially, acting in an ecologically rational manner is to adapt your behavior to suit the situation. Since every situation has different characteristics, it is foolish to behave the same way in all situations!

There are times in which deliberation and care are necessary before embarking on a course of action; there are other times in which quick, decisive action is needed. It is therefore impossible, on a practical level, to know in advance which kind of approach is best for solving a particular problem. One must first identify the nature of the problem, and any important features that may make this particular problem unique/different from similar situations one has already faced.


Academics tend to dislike such arguments, since this renders it impossible for researchers to determine in advance what the "correct" answer should be. After all, a researcher needs to present his or her ideas to skeptical peers! So it is far more defensible to tell your peers: "The correct answer is X, because this equation, based on principles of formal logic, has determined that the correct answer is X."

After all, the above approach has the appearance of airtight inevitability! If you say, "This equation yields X, therefore, the correct answer is X," you're much less likely to spark a heated debate than if you introduce the obvious subjectivity of "Situation P requires this equation, whereas Situation Q requires that equation. Since here, we have Situation P, this equation is necessary, so the correct answer is X. But if we changed these features, we'd have Situation Q, and the correct answer would be Y." An audience member could easily challenge you by objecting that we don't really have Situation P—we actually have Situation Q, or maybe Situation R. This debate could derail your entire presentation and make you look silly in front of a room full of your peers at a conference!

But is the point of research to avoid disagreement, or to advance knowledge?...

My overarching point is this: when academic research demonstrates that most people arrive at the wrong answer to a question, the participants' errors may be an artifact of the research process, NOT something inherently wrong with the human mind!

Next time a researcher tries to tell you that you're irrational, you shouldn't necessarily believe it...

https://www.walldevil.com/wallpapers/w02/853524-comics-nerd-philosophy-question-everything-stick-figures-xkcd.jpg

Wednesday, August 9, 2017

Multiple Regression Explained


How to interpret multiple regression

Regression is useful for making a predictive model. Let's say there's a positive linear correlation between K and N, but you suspect that Factors L and M also contribute to Outcome N


Make up a storysay, that Factors K, L, and M represent intelligence, persistence, and amount of sleep per night and N refers to a course grade.

So, to test the relative impacts of Factors K, L, and M on Outcome N, you can feed each factor into a regression model, and test whether each factor increases the fit. That is, a correlation between Factor K and Outcome N yields a Pearson's r of .64 and R2 of .4096. 

But, when you run a regression testing the effect of Factors K and L on Outcome N, you find an R2 of .5625, with a significant change in the R2 value. That means that Factors K and L together do a better job of explaining the relationship than Factor K alone. 

Then, you run a regression with Factors K, L, and M together, and find an R2 of .5929, with no significant changethis means that Factor M does not help to explain the relationship. Outcome N is due mostly to Factors K and L; Factor M is an unimportant predictor of Outcome N.

Voilà! There's regression in a nutshell! 

And, if you're confused about the math...remember in middle school or high school math, when you learned about "rise over run" and learned the formula y = mx + b? Yeah, that's a simple linear regression. With multiple regression, you can add multiple terms, such that y = ax1 + bx2 + cx3...+ z. But it's still the same concept, just with more predictors than that lone "mx" term.

In case you missed it, there are some fantastic, easy-to-use, and FREE stats programs available now! I review them here.
For more help explaining statistical concepts and when to use them, 
please download my freely available PDF guide here!
https://drive.google.com/open?id=0B4ZtXTwxIPrjUzJ2a0FXbHVxaXc

Saturday, August 5, 2017

When to use a chi-square


When to use a chi-square

Not clear about when you should use a chi-square vs. when to use a t test? 

First, you should check out my free, downloadable PDF, A Practical Guide to Psych Stats.

Now that that's out of the wayif you're still not sure, how about a tasty example? 
Let's say that we want to know whether a bag of Original Skittles has a truly random distribution of colors. If so, we’d expect to find roughly equal numbers of red, green, purple, yellow, and orange Skittles, right? 

A chi-square goodness-of-fit test [that is, a one-variable chi-square] can help us evaluate this. If there are 18 red, 13 green, 18 purple, 19 yellow, and 17 orange, the chi-square goodness-of-fit test tells us whether this distribution is different enough from an even distribution of 17 apiece (85 Skittles / 5 colors) that we can reject the notion that the colors are evenly distributed. 

If you're really curious about my made-up numbers, by the way, here's a straightforward, easy-to-use online calculator to help you: http://www.socscistatistics.com/tests/goodnessoffit/Default2.aspx

***
Now, let's say we’re looking for differences in the proportion of red Skittles to the other colors in a bag of Original vs. a bag of Tropical Skittles. 


In this case, we have two categorical variables [Original vs. Tropical Skittles, and unequal distribution of colors], so we would need a chi-square test for independence. The additional category makes the calculation a little more complex (but not if you use statistical software to handle the dirty work! 😊), but ultimately, we're looking at the same thing as before: are there roughly equal numbers of each type Skittles in each bag?

In case you missed it, there are some fantastic, easy-to-use, and FREE stats programs available now! I review them here.
For more help explaining statistical concepts and when to use them, 
please download my freely available PDF guide here!
https://drive.google.com/open?id=0B4ZtXTwxIPrjUzJ2a0FXbHVxaXc

Wednesday, July 26, 2017

The AI Apocalypse?


The AI Apocalypse?

Is AIartificial intelligence—hype or substance? Can machines think? Can they ever 
achieve consciousness? Will the AI "Singularity" eventually destroy us all?
 

Monday, May 1, 2017

Life Lessons


At the end of every semester, I hold a session for my students in which I talk about non-academic stuff. Since there are no classes and, often, no guidance on the everyday ins and outs of adulthood, somebody's gotta do something about this, right?

Right?!?!

So, I decided to do something about it! And I've made it available to everyone for free, right here! I've posted the PDF of my slideshow here, since I like to make things freely available for all!

To get my narration, however, you'll have to be one of my students...


https://drive.google.com/open?id=0B4ZtXTwxIPrjQW1VcXRFc0F4ZTg


Addition on Sept. 5, 2017 - I feel vindicated after discovering this John Oliver bit about retirement, which echoes much of what I wrote about finance in the above slides:


Nothing like watching an episode of Last Week Tonight a year after it hit YouTube! More like Last Year Tonight, amirite?...OK, maybe I should leave the comedy to the comedians :/

Wednesday, April 19, 2017

...And the winner is


...And the winner is...

In the ever-changing landscape of social media today, have you wondered lately what forms of social media college students are using most often?

The students in my Spring 2017 stats class were wondering this very question! So, as a brief introduction to research (and as an example of the one-way ANOVA, which we had recently covered), I offered my class the option to get a couple extra credit points for surveying 5 of their friends about their social media usage.

Read on for a snapshot of social media usage among college students right now!

Limitations

I intentionally designed the survey with a couple weaknesses, to give the students some practice at identifying those limitations. We used a 7-point Likert-type scale [it's pronounced LICK-ert, by the way! In case that link goes dead, here's a cached version].
  1. Only the endpoints on this scale were labeled: a 1 indicated "I never use this form of social media" and a 7 indicated "I use this form of social media multiple times per day."

    Not having any labels for the intermediate values is a weakness because it introduces an unacceptable amount of error based on how people interpret a particular number—how do we know that you and I interpret a value of "6" the same way?

    Answer: we don't. Hence, this is a weakness. And a rather serious one!
     
  2. Another major weakness is that these students each asked about 5 friends at Bowling Green State University.

    Given that this is a Psych Stats course, many students are Psych majors. Given that fact, they probably have a disproportionately high number of friends who also major in psychology. Are Psych majors representative of all BGSU students, let alone all college students?

    Not necessarily; hence, the sampling procedure is another major limitation of this study.

    For purposes of a class demonstration, this flawed sample is fine. But it severely limits the ability to generalize the results to all BGSU undergraduate students, let alone college students nationwide. Or, at least, the sampling procedure inspires some doubt about generalizibility.
     
  3. A third limitation is that I only included 5 forms of social media, rather than a more complete list. One student suggested including Tumblr, which is defensible—but for simplicity's sake, I shot that idea down.

    Respondents gave self-report data (on the aforementioned 1-7 scale) regarding their usage of: Facebook, Snapchat, Instagram, Twitter, and Pinterest. That's it.

    So, usage of LinkedIn, reddit, tumblr., Google+, flickr, SoundCloud, and other social networking sites were left out of the picture here. Even MySpace has stuck around, as musicians sometimes use it to gain additional exposure for their work. These sites are not captured in this survey.

Nonetheless, some data is better than no data! As far as student engagement goes, this data is also better than made-up data, because we're looking at real responses from real people—even if the survey methodology is less-than-ideal!

Results

The results of the survey are posted in .csv format on my Google Drive, publicly accessible here. I did the analysis in JASP, which I've previously recommended for many use cases (the complete analysis is available here) and in the even newer program jamovi (that analysis is available here).

Here's the [un-editable] graph generated by JASP:

And here are the descriptive stats:

A couple highlights:
  • Snapchat is the clear winner, with the highest mean (5.671) and the lowest SD (1.819)
  • Instagram takes second place, Facebook is a close third, and Twitter lags behind. Pinterest is a distant last place in this sample
  • The F-ratio was 'statistically significant': F(4, 360) = 22.08, p < .001
  • For effect size, I used eta-squared: Eta-squared = 0.197
  • A post-hoc analysis (with Tukey correction) reveals that Pinterest is significantly different from all others (duh!) and Snapchat is significantly different from Twitter. Instagram and Twitter are also significantly different.
     
  • Statisticians will note that Levene's test reveals a violation of the assumption of equality of variance. Strictly speaking, this means that we should not run an ANOVA; instead, we should use a non-parametric alternative like the Kruskal-Wallis H-test.

    In my experience, though, this rarely yields a fundamentally different result. And after you run the H-test, you still need a post-hoc test anyway!

For convenience's sake, I've screencapped the post-hoc test as well. [Click to enlarge image]

I ran the post-hoc test in the brand-new stats program jamovi, which allows you to run the post-hoc test with no correction or with several of the most frequently-used correction procedures. I like how jamovi let me do the analysis both ways, and showed the results side-by-side.

You can see that a post-hoc analysis with no correction for multiple comparisons yields a significant difference for Facebook vs. Snapchat. It also shows that Facebook and Twitter are almost, but not quite, significantly different (p = .055). Should we ignore this result because it didn't meet the sacred .05 criterion?

I'd say that we should consider it in the context of the study. What are we looking for? Patterns in usage of social media among college students (specifically, college students at BGSU).

What are we trying to accomplish? Well, let's suppose I'm trying to advertise a product or service to college students, in which case I want my ad to be seen by as many college students as possible, for as few $$$ as possible.

Even if the difference between Facebook and Twitter usage isn't significant at the conventional alpha level of .05, if we're talking about efficiency of time, effort, and money, it's close enough that I'd certainly consider advertising on Facebook instead of Twitter!

So is Tukey's correction (or another multiple correction procedure) necessary here? It's certainly debatable; I fall on the "no" side of things—after all, if there's a significant ANOVA, then there's clearly a significant difference somewhere, right? Multiple correction procedures reduce power, so if you use a correction like Tukey's test, you could end up with a significant ANOVA but no significant post-hoc results!

And significance is kind of overblown, anyway... 

_________________

Remember, if you're interested in a more nuanced analysis, you can download the .csv file linked above and run the analyses yourself! I suggest using JASP or jamovi, which are both free of cost and open-source!

Friday, April 14, 2017

Guides to pre-registered experiments


Guides to methodological pre-registration for experiments

If you're like me, you've considered doing a pre-registered study but put it off because you weren't sure what to expect or how much paperwork there would be. I've become a big proponent of open science [I'm working on a future blog post on the topic], as I think it's crucially important to make your materials, data, conclusions, etc. available to other researchers and to the wider public!

As Simmons, Nelson, & Simonsohn (2017) wrote, pre-registration and full methodological disclosure are crucial to the credibility of psychological research. If we want to be taken seriously as scientists, we should behave in accordance with the highest standards of scientific integrity...and that includes pre-registering our studies.

Why pre-registration? Two big reasons: 1) it prevents us from fooling ourselves about our own research findings, and 2) it gives us something we can point to and say "Yes, I planned to do that all along!"

And if we didn't actually plan it all along, it forces us to face the facts—which should serve to keep us humble.

Despite what some people may think, increased transparency is good for science. Period. Sanjay Srivastava gives the topic a thoughtful treatment here, and I agree with him. Our priority should be high-quality science first, PR/funding concerns a DISTANT second. If we have good science in the first place, many of the other concerns will evaporate.

So, here are two resources to give you a good overview of the pre-registration process, and to guide you through what's required:

Thursday, April 6, 2017

A replacement for SPSS?


Could this program be the end of SPSS?

I have previously recommended JASP as a useful—and free!—statistical software package. I stand by that recommendation (nay, I'm doubling down on it!) as JASP has the following advantages:
  1. A slick, easy-to-grasp user interface
  2. All of the major types of statistical test, including one-sample, repeated-measures, and independent-samples t tests, ANOVA, ANCOVA, correlation, regression, and even the chi-square test for independence [i.e. the two-variable chi-square]. It even has a module for structural equation modeling, for those who conduct such analyses!
  3. Bayesian analogues to each of the above tests
  4. A simple, one-click method to run these tests, which makes it an ideal instructional tool (and useful for many basic research needs as well). 
  5. It's a no-cost, open-source, cross-platform (Windows, MacOS, Linux) program, so there are zero barriers to personal use.
  6. It launches pretty quickly, and runs extremely fast—even on low-powered computers. 

JASP Screenshot from my own personal computer 

This image is freely available for use; just cite http://psychsci.blogspot.com/2017/04/a-replacement-for-spss.html

The recent [March 21, 2017] release of version 0.8.1.1 has rendered JASP is even more useful than it was in the past! Here's the latest major change to the program:
  • Data synchronization that (finally!) allows you to edit your data from within the program itself. You can sync a .csv file, .sav file, or .ods [LibreOffice spreadsheet] file.
Now that you can edit the data in a window in the statistical program itself (via data synchronization, which can be turned off if you so desire), and since a previous build allowed users to integrate JASP output with their OSF page, I think that JASP has finally become good enough to provide many researchers with all the statistical capability they need!

SPSS can still perform some of the more esoteric/advanced statistical procedures that JASP cannot, such as multi-level modeling. But since such procedures tend to be used relatively infrequently (at least in experimental social science research such as my own), JASP can probably handle the bulk of your analytical load.

Further, as a stats instructor, this tool is my secret weapon! I am encouraging students to use this program for an APA-style paper for which they have to run a handful of analyses to answer different questions.

This semester, I asked my Stats students how they felt about SPSS, and they generally weren't too fond of the program due to its complexity, pickiness, and uninformative error messages (not to mention an appearance that's stuck in the 1990s).

After I demonstrated JASP in class, the students seemed far more impressed with the free and open JASP than they were with the costly SPSS!

EDIT 5/30/2018: Just discovered that JASP is now available as an online resource, according to this blog post on the JASP website and a Tweet by E.J. Wagenmakers. You have to sign up for a RollApp account if you want to use this option.

And, if for some reason you're not a fan of JASP, a similar (and also free!) option called jamovi is under development. You can type data straight into this one, whereas I don't believe that's an option yet in JASP. jamovi lacks some features that JASP incorporates, but it's still a nice stats program for use in the classroom (or for your research)!

jamovi screenshot from my own personal computer
This image is freely available for use; just cite http://psychsci.blogspot.com/2017/04/a-replacement-for-spss.html

Should IBM be worried about SPSS adoption rates? Maybe...

Intrigued? Here is the website; you can download JASP by clicking 
the "Download" tab and selecting the version that's appropriate for your operating system. 
 
Or you can just follow this link instead. Hey, what do you have to lose? 
Try out this free stats program and see if it meets your needs! If it doesn't, you can just uninstall it...

If you'd like to try jamovi, here's the link for that.

Monday, February 27, 2017

Stat-ception II: How to fix statistics in psychology


Stat-ception Part II

I'm a star!

OK, my public speaking skills may not exactly have made me a star (yet!), but I AM on YouTube! I've included a link to my recent (Feb 2017) Cognition Forum presentations, as well as my current thinking about easily--and immediately implementable--solutions to ameliorate those weaknesses.

The first video goes into depth about the issues; the second describes my proposed solutions to those problems.

https://www.youtube.com/playlist?list=PLvPJKAgYsyoKcGOCKEYT2GyzK0yLVXvzN

For your viewing pleasure, I've also embedded the videos here:


Any feedback or advice is welcome!

I've also made the slideshows available on Google Drive. Here's the link to the first slideshow, so you can follow along: https://drive.google.com/file/d/0B4ZtXTwxIPrjTktiMGdoQ3JBSHM/view. And here's the link to the slideshow for the second video as well: https://drive.google.com/file/d/0B4ZtXTwxIPrjalZxdFJfUWNKTVU/view?usp=sharing

A draft of my manuscript on the topic (intended for eventual publication) is freely available for download at https://osf.io/preprints/psyarxiv/hp53k/. Since I'm an advocate of the open science movement, it's only right that I make my own work publicly available--hence why I uploaded these videos (and my manuscript) to public repositories.

You may not trust my own take on these issues, in which case I commend you for your skepticism! In the videos, I made numerous references to Ziliak & McCloskey (2009), Gigerenzer (2004), and Open Science Collaboration (2015)--all are worth reading, for anyone who cares about scientific integrity and the research process. All three works were highly influential in my thinking on this topic, though I cited a variety of other papers as well in my aforementioned manuscript.

You may disagree with my recommendations in the second video, and if so, that's okay! How to address the limitations of NHST and fix science is absolutely a discussion worth having; I advance my own ideas in the spirit of jump-starting such a discussion.

So, please put your thoughts in the comments, and share my work with colleagues who may be interested in the topic!

Monday, February 20, 2017

Stat-ception: Everything you think you know about psych stats is wrong!


In the spirit of open science, I have posted a video of a talk on statistical practice that I gave in the Cognition Forum at Bowling Green State University.


This talk was in 2 parts; the first part summarizes many of the common objections to null hypothesis significance testing (NHST) that thinkers have made over the decades, and the second part goes over my current recommendations to tackle the problem.


Part I is available at https://youtu.be/JgZZkMJhPvI; Part II is forthcoming! I've also embedded the video right here:

You can view and download the full slideshow at https://drive.google.com/open?id=0B4ZtXTwxIPrjTktiMGdoQ3JBSHM. The free (and very easy-to-use!) statistical program JASP can be found at https://jasp-stats.org/. JASP is useful if you want to run the analysis on the precision-vs-oomph example that I discuss at the end of the video (at the 39:41 mark).

I have already tackled some of the issues with NHST on more than one occasion in prior posts here, and I have also provided a practical guide to psych stats as a freely available educational resource!

There are a variety of excellent papers on the topic of statistical practice in social science fields; my working paper on the subject summarizes them. In the interest of open science, I've made this working paper available at https://osf.io/preprints/psyarxiv/hp53k/. Other great resources on the topic include Gigerenzer (2004) and Ziliak & McCloskey (2009), which are also freely available.

ResearcherID