...And the winner is... (Part II)
Which form of social media reigns supreme among college students today?

You may or may not have seen the results I shared here in April 2017. My Stats class at BGSU in Spring 2017 collected the data, and I used it to demonstrate the one-way ANOVA.
If you haven't already seen it, here's that summary. As I explained in the original post, the survey was intentionally flawed, in order to give students practice at picking out problems/weaknesses in survey research:
1. Only the endpoints on this scale were labeled: a 1 indicated "I never use this form of social media" and a 7 indicated "I use this form of social media multiple times per day."However, as I also noted in that post, it's better to have some data than to merely guess!
...how do we know that you and I interpret a value of "5" the same way? Answer: we don't. Hence, this is a rather serious weakness.
2. ...the sampling procedure is another major limitation of this study. For purposes of a class demonstration, having students ask their friends is fine. But this flawed sample severely limits the generalizability of the results...
3. A third limitation is that I only included 5 forms of social media, rather than a more complete list...usage of LinkedIn, reddit, tumblr., Google+, flickr, SoundCloud, and other social networking sites were left out of the picture.
If we want a glimpse into the social media usage habits of college students today, this provides a picture of that behavior. Perhaps it's an impressionistic picture that doesn't perfectly reflect reality, but it can still give us a good sense of the answer to our question.
You may recall from the post in April 2017 that Snapchat was the most popular social media platform among students at a medium-sized state university in Ohio. Were the responses of my students' friends representative of the entire campus? Probably. But, like any assumption, this could certainly be wrong.
As of the Fall 2017 semester, I'm teaching at Lyon College, a small, private, liberal-arts school in Arkansas. Might these students have different social media habits than their state-school counterparts? Or perhaps, in the notoriously fickle world of social media, might trends have changed over the past 6 months or so?
So, here's the same survey, part 2, done in November 2017. Enjoy!
Results
Once again, I've posted the data (in .csv format) for you to view and/or download for yourself.
Recall that people responded on a scale of 1-7, with 1 being "I never use this form of social media" and 7 representing "I use this form of social media multiple times per day."
As before, we'll lead off with the graph of the means, from JASP. As you may recall, this graph cannot be edited.
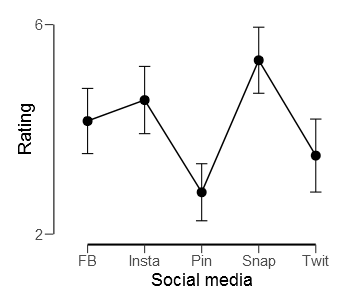
For reference, see the plot from Spring 2017 here. Note that the scale only goes up to 6 here rather than 7, so be aware that this graph is going to be more stretched-out vertically than the graph from April 2017. Don't blame me; blame the software! I'd fix it if I could...
You don't have to worry about any such distortion for the descriptive stats:

So, between this table and the graph above, the finishing order should be clear:
- Snapchat
Note that N = 50 here; in April 2017, N was 73. As before, I offered extra credit to my students for participation. For whatever reason, there happened to be fewer participants this time. Welcome to the real world of research!
That said, I don't think that the difference between 50 and 73 is really that big. I would have liked to have 20 or 25 additional responses this time to maximize the similarity, but part of conducting ethical research is that you cannot compel people to participate. In order to keep the procedure comparable, I presented the opportunity in November the same way I did in April.
Highlights:
- As in the spring, Snapchat is the winner. Twitter comes in below the midpoint, and Pinterest is least-used among college students.
- The mean scores here were slightly lower than they were in April, with the exception of a very slightly higher score for usage of Pinterest. Since it's up from 2.71 to 2.8, I'd chalk that up to variance due to the smaller sample, and/or regression to the mean.
- Of these comparisons (InstaSpring— InstaFall,
SnapSpring— SnapFall, etc.), there is only one change that is statistically significant. Can you determine which one?
- Overall, the pattern we observe here is very similar to the pattern in April 2017. So apparently no semester-to-semester changes in social media popularity!
- Once again, SDs were around 2, except for the higher variance (SD = ~2.5) for Twitter usage. This suggests that students either use Twitter a lot—or not at all! So it seems that Twitter has high engagement among those who do have accounts.
- A one-way ANOVA shows a statistically significant effect, F(4, 245) = 9.563, p < .001, partial η2 = .135. This is shown below.


The post-hoc analysis reveals a number of significant differences. One comparison (Facebook vs. Snapchat) does not quite reach the traditional alpha level of .05. Should we therefore conclude that this difference isn't worthy of note?
- Multiple correction procedures reduce the power to detect an effect (this is true whether you're using the Bonferroni, the Tukey, or the Scheffé procedure), so, given that an ANOVA already showed a significant difference, you would arguably be justified in simply running a series of t tests, or Fisher's LSD, instead of an adjustment like Tukey's procedure.
I used Tukey here, simply because it's both conventional and easy. But if I were to do this for anything beyond intellectual curiosity, educational demonstrations, and a blog—I'd think pretty intently about which correction procedure, if any, to use.
- Furthermore, I've already made my case that statistical significance is overblown, so if my own personal money were involved (for example, if I'm advertising to college students), I'd be apt to take careful note of the difference between Snapchat and Facebook usage—regardless of whether that difference crosses the arbitrary threshold of .05!
_________________
Remember, if you're interested in a more nuanced analysis, you can download the .csv file and run the analyses yourself!
I recommend using JASP (my analysis, shown above, was done with JASP), which is free of cost and open-source! Another alternative is jamovi, which is very similar, and also free and open-source (but not quite as well-developed yet).
Each program has its own advantages and disadvantages, of course. But I think the benefits of these programs far outweigh the limitations! I use JASP for teaching undergraduate stats, to pretty good effect.
Each program has its own advantages and disadvantages, of course. But I think the benefits of these programs far outweigh the limitations! I use JASP for teaching undergraduate stats, to pretty good effect.
No comments:
Post a Comment