Lies, Damned Lies, and Statistics
In an interesting post, Michael Batnick, the Irrelevant Investor, makes a critical point about the oft-overlooked limitations of data in the world of behavioral finance: http://theirrelevantinvestor.com/2018/04/04/the-limits-to-data/
“Using Excel shows you how a robot should allocate its lottery winnings.
It doesn't show you that 70% of human lottery winners go bankrupt.”
Darwin famously didn't trust complicated mathematics ("I have no faith in anything short of actual measurement and the Rule of Three," he wrote in a letter). He wasn't wrong: complex procedures can obscure what's going on 'under the hood.' This can render a formula's weaknesses virtually invisible.
Have you heard about the studies showing that irrelevant neuroscientific information in a research summary makes people rate the conclusion as more credible? The same seems to go for math—when people see some complex, technical information, they'd often rather just believe it instead of thinking critically.

By Signe Wilkinson, for the Philadelphia Daily News
http://www.bcps.org/offices/lis/researchcourse/images/statisticsirony.gif
It's not that it's a bad thing to gather data. Rather, it's that a presentation of complex data can obscure as much as it reveals. That goes double if the results haven't been presented carefully, and with an eye toward maximum clarity.
Moreover, focusing on statistical analyses can yield a myopic view of the situation. I know from hard experience that it can be easy to get so wrapped up in the mathematics that you can lose sight of the overall picture, as this cartoon by Chris Madden so cleverly illustrates.
For example, suppose I want to compare the rates of participation in various extracurricular activities among college students. I get a national sample of about 50,000 college students, and when I run the proper analyses to compare these results, I discover a significant chi-square result for participation in every single activity when categorized by gender! Not only that, but I also get significant chi-squares when I evaluate participation in every activity when categorized by participation in every other activity.
In sum, everything is significant! The above example is taken wholesale from an actual, real-world analysis described on p. 205 of Meehl (1990), "Why summaries of research on psychological theories are often uninterpretable."
Indeed, it's a seldom-noted but mathematically necessary property of significance tests that as sample size increases, p decreases (all else held constant). So if you want significant results in your experiment, just keep running participants until you have a humongous sample...
Along the same lines, check out Simmons, Nelson, & Simonsohn (2011). If you've ever run a correlation on a dataset with many variables, found that the resulting p-value didn't cross the magical .05 threshold, and decided to run additional analyses ('well, what if we control for X? Still not significant? Okay, how about if we control for Y?'), you're guilty of abusing "researcher degrees of freedom."
This behavior is so common that just about every behavioral researcher has done it at some point! But just because everybody's been doing it for decades doesn't make it good scientific practice...
Significance at the .05 level (or the .005 level, as a recent proposal promotes) is therefore overblown. But that context-free interpretation procedure is taught to tens of thousands of students every semester—and all because it's the de facto standard of getting published in many peer-reviewed journals.
But when you spend all your time trying to hurdle that p = .05 obstacle, you frequently end up missing the point. It is a common mistake for my Psych Stats students—even the brightest ones—to get a question completely wrong, because they're mechanically operating the formulas without stopping to think about whether the result makes sense given the data. No matter how many times I repeat that it's important to look at the means, sketch a graph, and so forth, such mistakes remain common.
It's the mechanization, the bureaucratization, of statistical inference.
Any statistician worth his/her salt would object to such mechanization. Every dataset is different, and nuances can be crucial to understanding! If an analysis doesn't yield a p-value at the sacred .05 criterion, the observed effect may nonetheless be interesting and useful.
And even if it does yield a tiny p-value, that effect may be so small that it isn't worth thinking about.
Think about your data. There is no substitute.
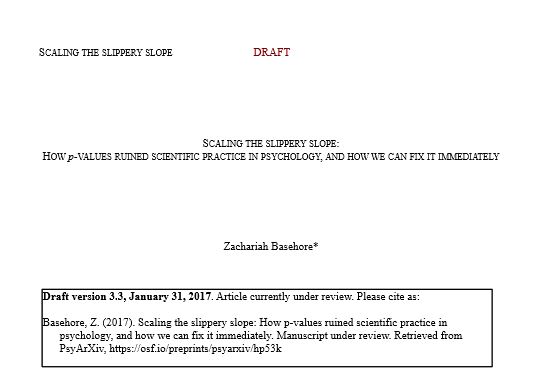
Want more juicy academic details? Read my preprint about the problem
with most applied statistics in the academic realm:

No comments:
Post a Comment